Science
Water Quality Monitoring Data
For its size, Oyster Pond is one of the best studied coastal ponds on Earth.
Pioneering research by K.O. Emery in the 1960s has been followed up with numerous additional studies of physical, chemical, and biological aspects of the ecosystem.
Deteriorating water quality in Falmouth’s coastal ponds in the mid-1980s propelled the formation of the Falmouth “Pond Watcher Project”. Citizen volunteers were recruited to collect water samples at Falmouth’s coastal ponds to document their water quality status. Since 1987, Pond Watcher volunteers have sampled Oyster Pond at four locations across the pond during July and August. This has generated a significant amount of historical data on the water quality of Oyster Pond.
In 2005, OPET initiated its own water quality monitoring program. OPET expanded the sampling regime of the Pond Watchers to include other parts of the year. OPET also expanded the sampling to include phosphorus, chlorophyll and silica as well as nitrogen.
The salinity of Oyster Pond is crucial to the health of the ecosystem. Salinity in Oyster Pond is like Goldilocks, we don’t want too little or too much – it has to be just right. Between 2 ppt (parts per thousand) to 4 ppt is optimal for the herring and white perch populations, and to prevent toxic algal blooms.
OPET Water Quality Data
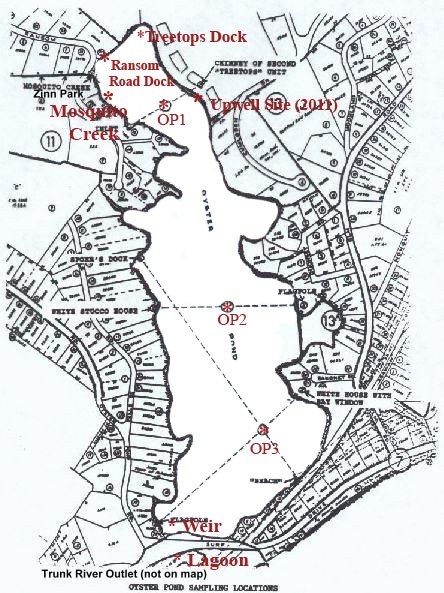
Sampling Stations for OPET Water Quality Monitoring
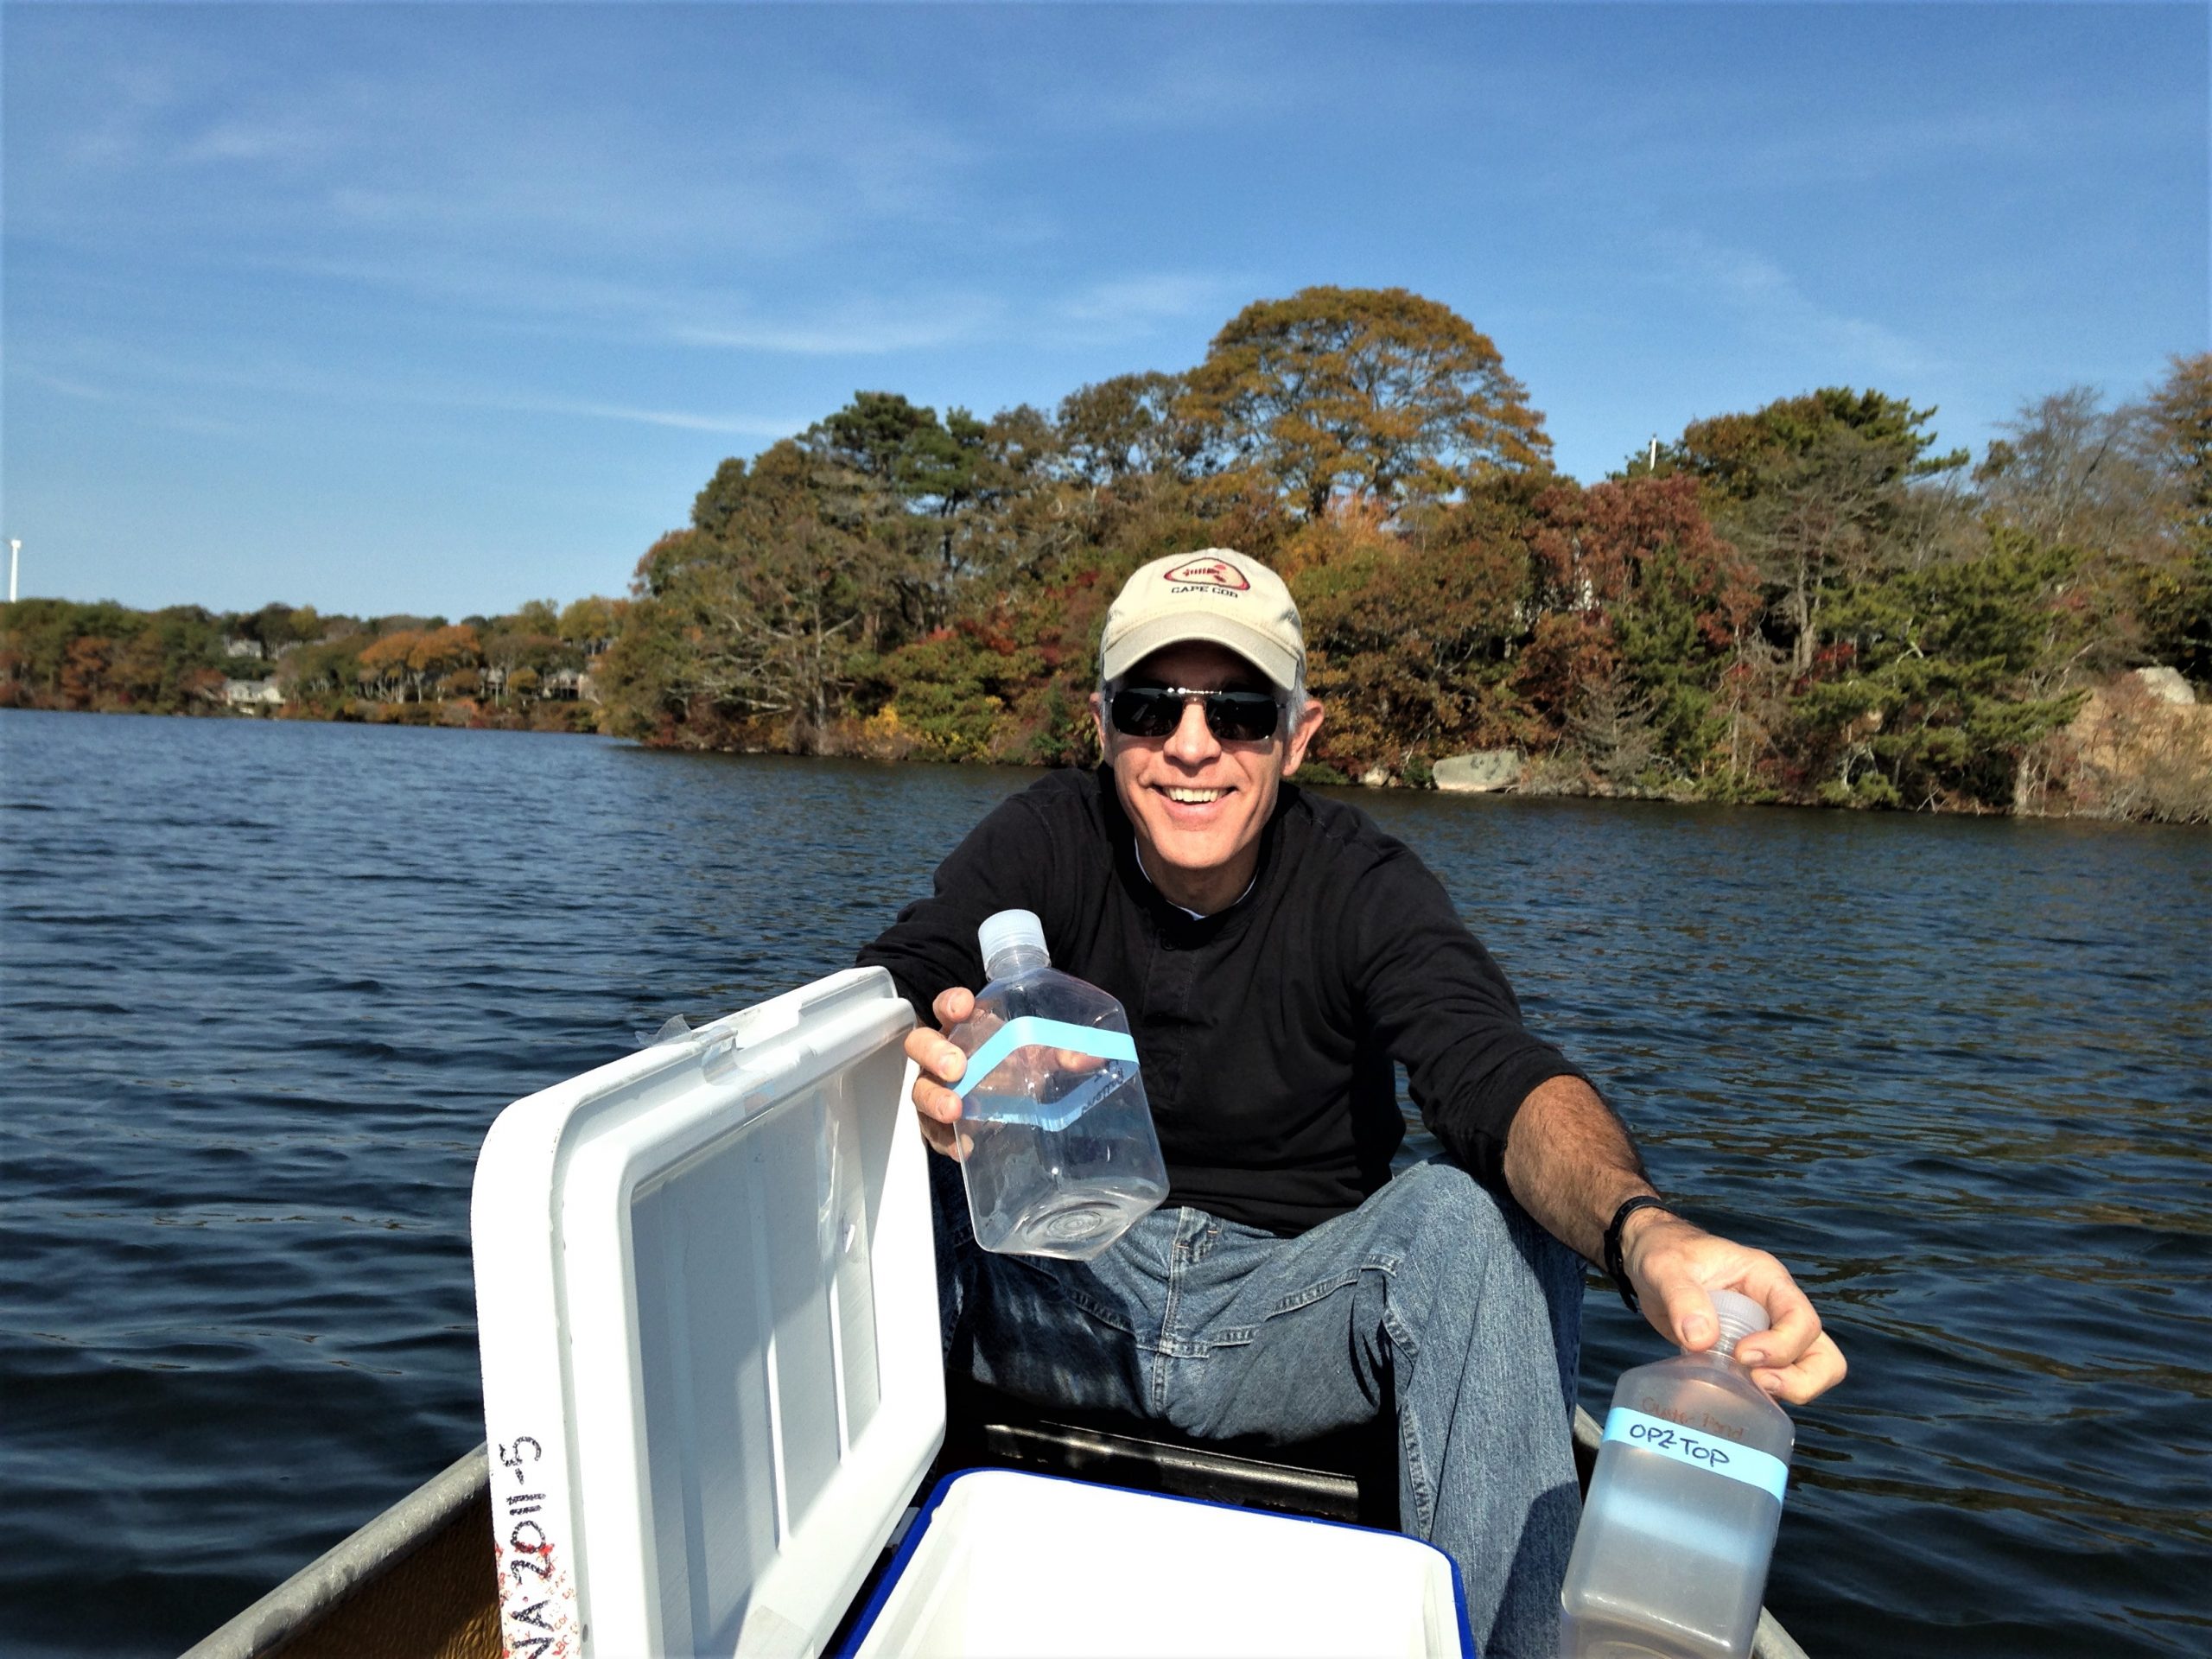
OPET began a water quality monitoring program in 2005. Water quality samples in the beginning were collected approximately every month to see seasonal and interannual trends in water quality to be related to the ecological health of the pond. Samples were collected from several locations throughout Oyster Pond, including three sites along the axis of the pond, four sites near the shoreline, and at the outlet of the pond near the weir. In addition to measuring temperature, dissolved oxygen, pH, conductivity, salinity, and water clarity in the field, samples were also analyzed for concentrations of nitrate, ammonium, total nitrogen, and total phosphorus at the Woods Hole Research Center.
Thanks to Dr. Ben Hardin of the SEA Semester, we can now visualize the OPET collected data. He organized the data into a program that plots it in an easy way to see the results. MANY THANKS to Ben for this work!
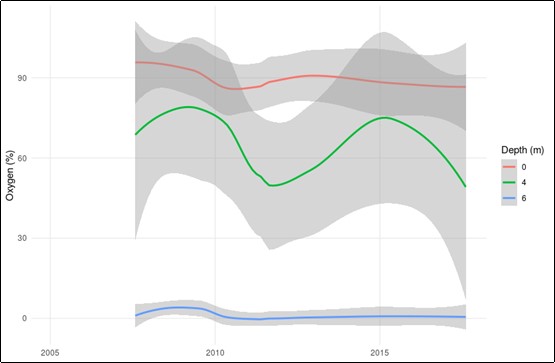
Here are the oxygen levels at sampling station OP 3, the deepest point of the pond. As you can see, there is little to no oxygen at 6 meters at the bottom of this flooded kettle hole.
2005 – 2017 Compiled OPET Data Spreadsheet
The following spreadsheet includes nutrient measurements, salinity, oxygen, temperature and turbidity. All DATA 2005-2017
OPET Water Sampling Data 2004 – 2017
OPET Data 2017 -2004 2017 Data June 2017 | July 2017 | Aug 2017 2014 & 2015 & 2016 Data Aug 2014 | Nov 2014 | May 2015 | [...]
Monitoring Oyster Pond’s Salinity
Sampling locations for the CTD casts and other equipment.
It is always a balancing act to maintain Oyster Pond’s salinity within the 2 ppt to 4 ppt range. If the salt level is too low we risk a repeat of the terrible pea-green soup algal bloom of the summer of 2016. The algae that caused that bloom is still in the pond sediments. A bloom could redevelop if the salinity dropped below 1 ppt as it did in 2016 and we had the same hot drought conditions as that year. If the salinity is too high, however, it decreases oxygen at the bottom of the pond, which is detrimental to our herring population and other aquatic creatures. That is why we so carefully monitor the flushing and salinity of the pond to make sure the pond stays within these levels.
This salinity range was selected after the pond experienced a dramatic decline in water quality in the 1980s. The decline was caused by two major environmental changes. There was a drastic increase in nutrient levels (nitrates, phosphates) in the pond, due to the burgeoning human population in the pond’s watershed area. Additionally, salinity levels increased dramatically with the construction of a new, much larger culvert at the pond’s outlet into the Lagoon. This new culvert was too large and allowed in too much salt water. As a result, the heavier salt water sank to the bottom of the deep basins in the pond. This salt water became anoxic, or lacking oxygen, and stressed the pond’s ecosystem. Scientists studying the pond agreed that a return to the former brackish salinity levels would improve water quality by increasing oxygen levels to deeper depths.
One of OPET’s biggest management issues is keeping the exchange between the pond and ocean open. Storms are a constant challenge as they bring in fine sands and dead eel grass that clog both the river and the Lagoon. OPET is thankful to the Town of Falmouth for working with us to keep the system open by dredging Trunk River and the Lagoon when they are clogged. Learn more here under What We Do.
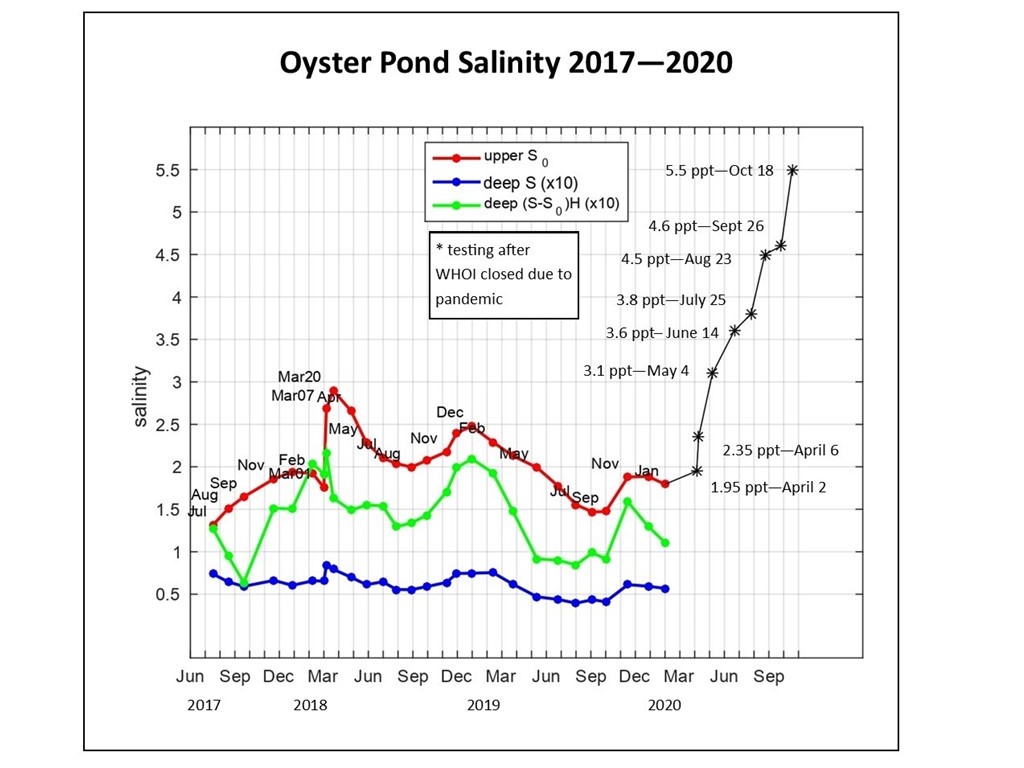
October 2020 Salinity Levels now too high
Many thanks to Mike Spall who tests the salinity pond nearly every month from his kayak. Mike, a member of the OPET Board and a scientist at WHOI, had [...]
WHOI Scientists Helping us Understand the Pond
OPET is thankful for the help of scientists at the Woods Hole Oceanographic Institution who are helping us understand the Oyster Pond system. Intrigued by the Oyster Pond’s dynamic [...]
Pond Watchers
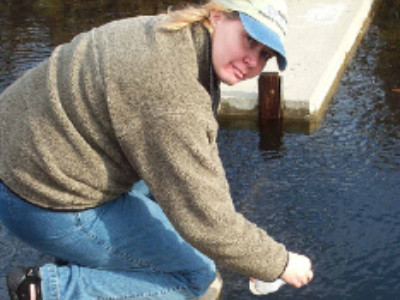
In 1987, concerned Oyster Pond residents joined the Falmouth Pond Watchers, a program that used volunteers to collect samples to monitor the water quality health of estuaries in Falmouth. The Town of Falmouth joined with the Woods Hole Oceanographic Institution to study the problems of deteriorating water quality in the estuaries in Falmouth. Skyrocketing housing development in Falmouth and Cape Cod in the 1970s and 1980s with its backyard septic systems caused a substantial increase in nitrogen in estuaries.
Sampling was initially in June, July, August, and September, but analysis revealed that testing in July and August would be enough. Samples are now taken just twice in July and twice in August. The sampling continues with the School for Marine Science and Technology (SMAST) at U Mass Dartmouth. Four stations, spread across the pond, are sampled at various depths. (An article about the Falmouth Pond Watchers appeared in the Falmouth Enterprise Aug 15, 1988, “Sample From Oyster Pond Resembles Pink Lemonade.”)
The testing led to a management plan for the pond the preparation of which was the initial goal of Pond Watchers. The testing revealed that Oyster Pond has a fresh water layer on top of saltier, heavier water on the bottom. This saltier water had little to no oxygen, making it impossible for fish to live there. The management plan called for controlling the salinity of the pond at 2-4 ppt and lowering the boundary of the salt water as much as possible (by comparison Vineyard Sound is 32 ppt salinity). To do this, it would be necessary to limit the influx of ocean water. OPET worked with Dr. Brian Howes to design and build the weir that is now in place at the outlet of the pond. This work was funded by a Town Meeting article. By adjusting the height of the boards in the weir’s openings, only the highest high tides can enter the pond thus limiting the amount of salt water entering the pond. (Falmouth Enterprise November 27, 1989, “Falmouth Pond Watchers Are Troubled by the Evidence that Pollution is Widespread.”)
Several reports were published documenting the falling water quality. This dataset was used as a basis for the Massachusetts Estuaries Project for Oyster Pond.

Pond Watcher Reports
Reports of Citizen Volunteer Monitoring of Water Quality in Falmouth's Coastal Ponds March 1990 -Results from 1987 & 1989 April 1991 - Results from 1990 April 1992 - Update [...]