OPET is thankful for the help of scientists at the Woods Hole Oceanographic Institution who are helping us understand the Oyster Pond system. Intrigued by the Oyster Pond’s dynamic system, four Woods Hole Oceanographic Institution scientists are donating their time and instruments to study the pond’s salinity levels. Dr. Rocky Geyer, Dr. Malcolm Sculley, Dr. Mike Spall and Dr. David Ralston are helping OPET understand the role of high tides, wind, and the pond’s outflow in regulating its salinity.
Working with the WHOI scientists, we hope to answer the following questions: when are the tides high enough to bring salt water into the pond, how often does this happen, what are the impacts of storms and wind, and how much salt water is needed to maintain appropriate salinity levels? It is known that big tides bring salt water into the pond, but we don’t know how frequently this happens or the volume of the water.
In mid-July 2017, RBR 420 Temperature/salinity sensors with Hobo pressure sensors were placed at the entrance to Oyster Pond (station #9 on the map) and the Lagoon (not shown on map). Each was about a foot below the water surface in just over two feet of water. At the OP1 (station #2) and OP3 (station #7) moorings, Seabird microcat temperature/salinity/oxygen sensors were deployed at about 3 feet below the surface and 3 feet above the bottom of the pond. The instruments were retrieved at the beginning of November.
Additional data was also collected with a CTD or a Conductivity, Temperature, and Depth sensor. While the other instruments were left in place for three months, the CTD was simply dropped over the side of a boat or canoe and pulled up at the nine stations shown on the map on three occasions
You can see over time the salinity increasing at all of the locations, especially after the October 30th storm. Again, it brought in a substantial slug of sea water into the pond. The higher salinity in the deep basins are reservoirs of high salt water that can mix with the upper levels during high wind events. The temperature sensor also shows that this salt water input was warmer than the pond water. There were problems with the oxygen sensor so they are not displayed here.
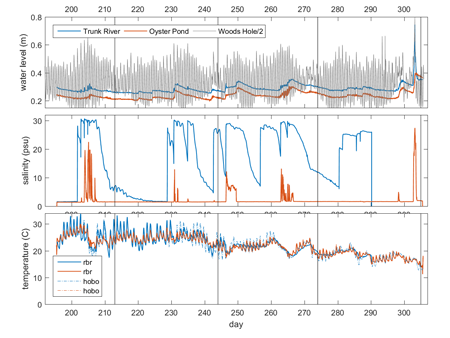
The top panel displays water level data from two Hobo sensors located at Trunk River and at the entrance to the pond. The water height of Vineyard Sound at Woods Hole is also shown for a tidal reference (divided by two to fit on the same scale). The vertical lines mark the start of each month. The big surge from the October 30th storm is clearly seen! It also shows the “spring tides”. Spring tides are a bit of a misnomer. Spring tides occur each month during the new and full moons not just during spring. Rather, the name derives from the saying “springing forth.” The graph demonstrates that salt water can only enter Trunk River during the spring tides or when there are strong east winds during a storm. The water level has to be higher in Vineyard Sound than in Trunk River. During the four month recording period, this happened five times. When this happens, the salinity in Trunk River is nearly as high as Vineyard Sound.
The middle panel shows the salinity levels over the four months. At least five big influxes of high salinity water entered the pond, generally corresponding with increased water level in Trunk River from the Sound. Each event pushed the salinity in the pond up a little bit. The RBR at Trunk River stopped recording in mid-October because it became clogged with an eel grass/algal mat.
The bottom panel is temperature from both the RBRs and the Hobos. The instruments track each other except midway through when the RBR at Trunk River became clogged.